Resources
Creating a Chart View
If you are unfamiliar with chart views, learn more here: What is a Chart View?
The first true step when creating a chart view occurs before ever logging on to the Syntelic application. Before beginning any configuration within the system, take a moment to think about the data types, metrics, and purpose of the view. Consider what information will display on each axis, and where it can be found within the database. Outlining the end-product at the outset typically reduces configuration time and produces a more streamlined, effective result.
Step 1- Choose a Chart Type
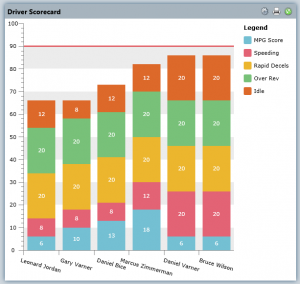
There are five chart types available in Syntelic: bar, stacked bar, line, stacked line, and pie. 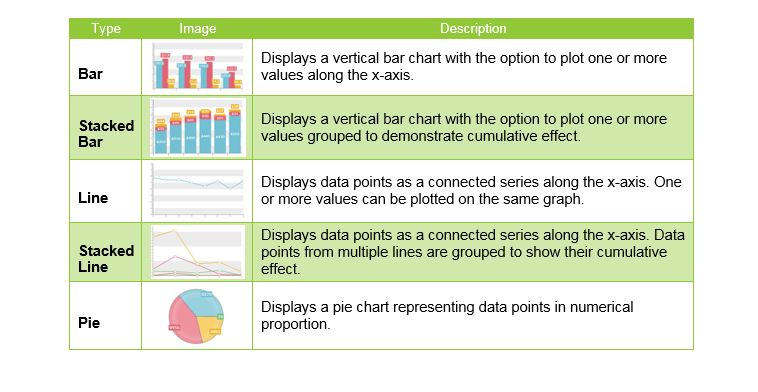
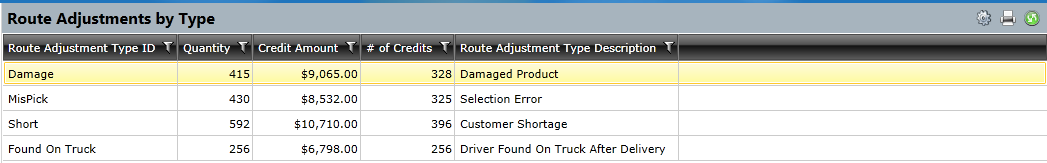
Step 2- Create a Table View
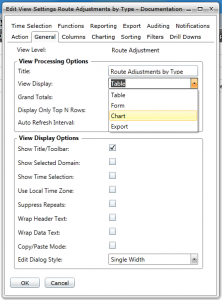
Underneath the visual exterior of any chart view is a table view. The default View Display type for a new view is Table. When creating a new view or modifying an existing view, the View Settings dialogue will appear. Under the General tab, the View Display drop-down lists the four View Display types
Creating a standard table view before configuring any charting options often simplifies the validation of any column grouping and minimizes the need to revert back to before applying the graphical overlay.
Step 3- Change a Table View to a Chart View
Once the table view has been created and the data appears as desired, three steps are required to convert the table view to a chart view. Once completed, the view will always display graphically when run.
Change the View Display Type to Chart
First, bring up the View Settings dialogue and click on the General tab. Change the View Display parameter to Chart. To revert the view to the table display type, reverse the steps above and re-run the view.

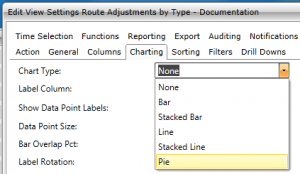
Set the Chart Type on the Charting Tab
After setting the View Display, navigate to the Charting tab, and choose the desired Chart Type.
Step 4- Configure the Chart Tab
Now that the view has been converted to a chart type view, the remaining Charting tab parameters can be configured.
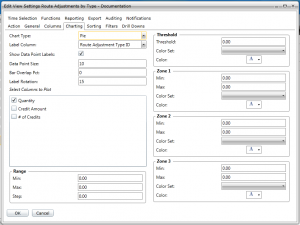
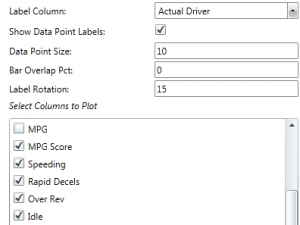
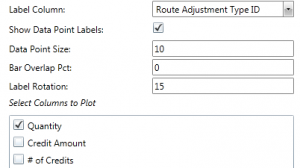
The following is a description of how to configure each parameter in the Charting tab: Parameter NameDescription Label ColumnDefines the x-axis data column. Not all columns are selectable. Show Data Point LabelsWhen selected, the numerical value of each graphical data point will display on the chart. Data Point SizeControls the size of the data point label. Bar Overlap PctDetermines how far horizontally bar chart bars overlap when more than one bar group displayed. This is only for standard bar charts. Label RotationControls the display angle of the x-axis text.
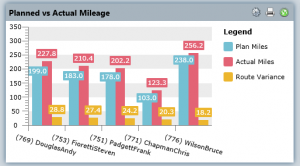
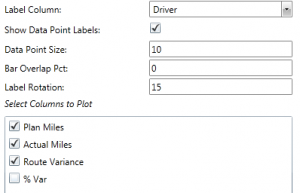
Columns to Plot
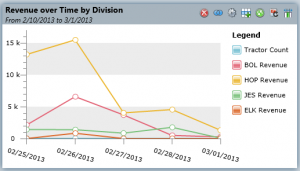
While the appropriate business use of each graphical tool is beyond the scope of this document, each chart type may require specific configuration and/or data grouping. On a bar or line chart, selecting additional columns will plot the data in a different color, shown in the chart Legend.
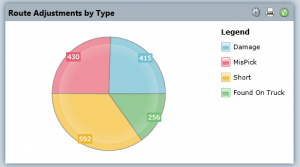
For a pie chart, the Label Column parameter determines the legend entries automatically based on the available data.
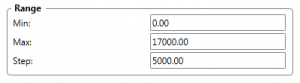
Range
Set a custom y-axis range here. If all range parameters are set to 0, the system will automatically scale the data.
The Min, Max, and Step parameters can be configured as needed to show the proper scale.
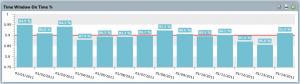
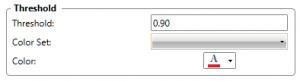
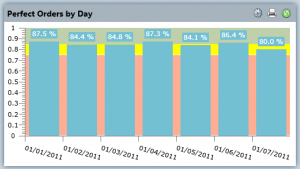
Thresholds
Set the threshold value to include a reference line on bar, stacked bar, line, and stacked line charts.
Choose a Color Set and select a Color for the line.
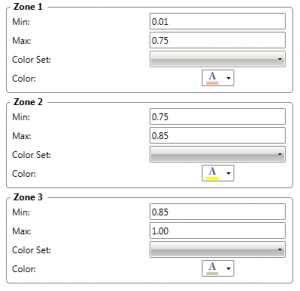
Zones
Set the Min and Max zone values to include a reference range.
Choose a different Color for each zone to differentiate them visually.
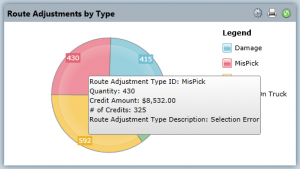
Tooltips
When hovering over a chart element, a tooltip will appear over the data. The grey box will contain the columns of the report, which are normally visible when the view is set to display as a table.
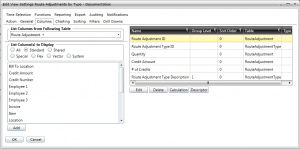
To prevent any column from appearing in the view tooltip, navigate to the Columns tab and select the appropriate column to remove.
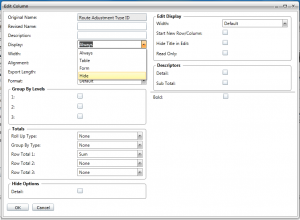
Select the Edit button to bring up the Edit Column dialogue. Click on the Display parameter and select the Hide option from the drop-down. Click OK to return to the View Settings dialogue.
Close and Re-Run the View
Once all Charting tab configuration has been completed, click OK to save any changes. Note: the changes will not take effect until the view has been closed and re-run. Close the view from the Workspace and run it from your Menu or Action View.